Methodology
This analysis uses a scenario framework that combines market pricing, route/shipping evidence, policy signals, and macro confirmation data. Assumptions are reviewed on a weekly cadence and stress-tested under base, escalation, and tail-risk regimes.
- Primary decision focus: Is the drawdown a shock event or the start of an earnings regime reset?
- Signal lens A: drawdown depth and credit confirmation
- Signal lens B: sector dispersion and valuation reset speed
TL;DR
- Equities often fall first and think later; medium-term outcomes depend more on earnings, credit, and policy than on opening-day headlines.
- History shows many wartime drawdowns bottom before investors feel comfortable again, which is why all-in exits often miss the rebound.
- Sector dispersion matters as much as the index because energy, defense, and some defensives can offset weakness in travel or cyclicals.
- The real question is whether the conflict changes the earnings cycle or only the news cycle.
What We Know
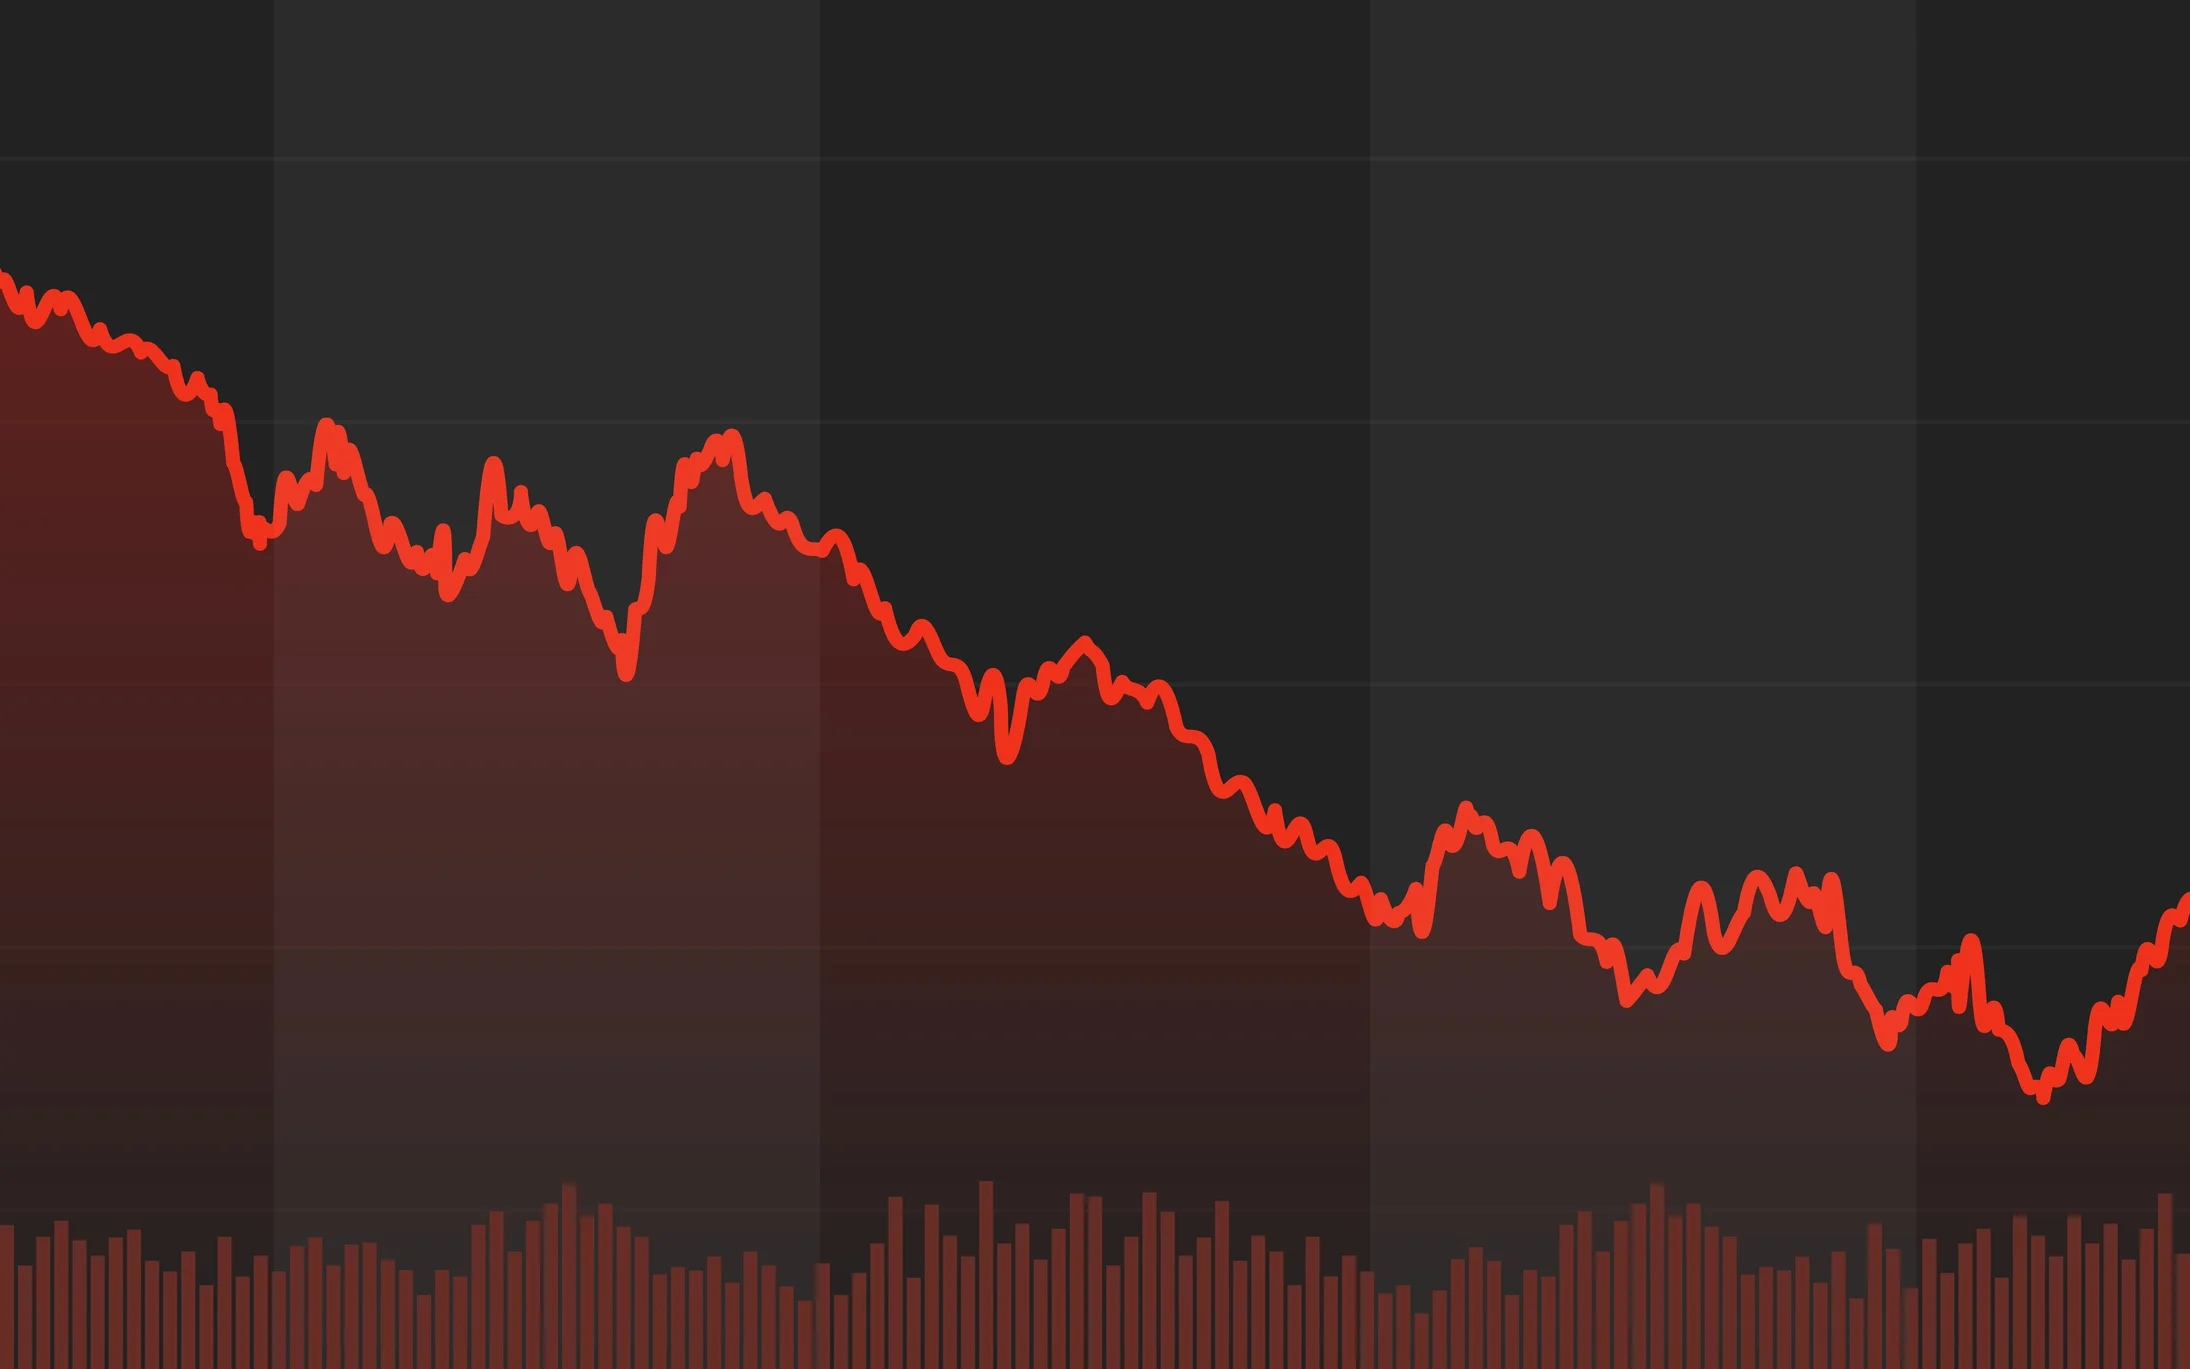
Market history is messy, but the broad pattern is familiar: initial selling is common, while 6- to 12-month outcomes depend more on the inflation and growth backdrop than on the war label by itself. Price action is therefore most useful when paired with earnings and credit evidence, not when treated as a standalone verdict.
That is why FRED index data, World Bank macro data, and IMF macro work belong together on this page. The event shock matters, but the durable damage usually comes through margin pressure, slower demand, tighter financing, or an energy spike that lasts longer than expected.
For confirmation, compare this section with Defense Industry Stocks and Sector Impact Analysis During Conflict and War Recession Risk: Indicators, Transmission, and Scenarios. That keeps the page connected to adjacent signals instead of a single isolated narrative.
How To Separate A Shock From A Regime Change
Investors get into trouble when they treat every geopolitical selloff as identical. A short, sharp drawdown driven by uncertainty behaves very differently from a conflict that keeps oil high, widens credit spreads, and forces earnings revisions across sectors.
The useful discipline is to ask what has actually changed in the transmission chain. If the answer is mainly sentiment, the recovery can come early. If the answer is margins, financing, and demand, then the drawdown deserves more respect.
- Watch credit spreads alongside the index instead of using price alone as the signal.
- Track earnings revisions before assuming a rebound means the risk is gone.
- Check whether oil and shipping stress are fading or compounding inflation pressure.
- Compare sector leadership with prior shock episodes rather than assuming the index tells the whole story.
To pressure-test this assumption, review Wartime ETF Comparison: Energy, Defense, Gold, and Treasuries and The FY2026 U.S. Defense Budget Request: Procurement Signals to Watch. The combined read is usually more decision-useful than treating this page as a stand-alone answer.
What's Next
The next decision point is whether policymakers and companies absorb the shock or whether it resets margin expectations. If the economic damage stays contained, recovery can look surprisingly fast and uncomfortable for anyone who sold in panic. If inflation and financing conditions worsen together, the drawdown can evolve from event risk into a broader bear-market problem.
That is also where sector rotation becomes more important than headline trading. Some industries may already be adapting while others are only beginning to reflect the new cost structure.
Why It Matters
This page should help readers avoid two expensive instincts: panic-selling on day one and assuming every rebound proves the danger was fake. The better framework separates headline shock, earnings risk, and sector exposure so the response fits the problem.
That makes the page useful for ordinary investors as well as for market watchers. Most people do not need a heroic call on the exact bottom; they need a disciplined way to tell volatility from lasting impairment.
If this signal shifts, cross-check Defense Industry Stocks and Sector Impact Analysis During Conflict and War Recession Risk: Indicators, Transmission, and Scenarios. Read them together so stock market during war sits inside a wider transmission chain.
Contextual next steps for stock market during war: Portfolio Protection in Wartime: Evidence, Hedges, and Mistakes; Defense Stocks Analysis: Contractors, ETFs, and Conflict Cycles; Defense Industry Stocks and Sector Impact Analysis During Conflict; War Recession Risk: Indicators, Transmission, and Scenarios; Wartime ETF Comparison: Energy, Defense, Gold, and Treasuries. Use this sequence to validate assumptions before adjusting allocations.
- Portfolio Protection in Wartime: Evidence, Hedges, and Mistakes - complementary read 1 for stock market during war.
- Defense Stocks Analysis: Contractors, ETFs, and Conflict Cycles - complementary read 2 for stock market during war.
- Defense Industry Stocks and Sector Impact Analysis During Conflict - complementary read 3 for stock market during war.
- War Recession Risk: Indicators, Transmission, and Scenarios - complementary read 4 for stock market during war.
- Wartime ETF Comparison: Energy, Defense, Gold, and Treasuries - complementary read 5 for stock market during war.
FAQ
Does the stock market always fall during war?
No. Initial drawdowns are common, but medium-term outcomes are often positive unless macro damage persists.
How long do conflict drawdowns usually last?
Many episodes bottom within weeks to months, though inflation-driven regimes can extend recovery.
Which sectors usually hold up best?
Energy, defense, and selected defensive growth areas often show stronger relative resilience.
Is timing war headlines effective?
Evidence generally favors disciplined holding and rebalancing over repeated tactical exits.
What should investors monitor first?
Credit spreads plus earnings revision trends are practical confirmation signals.
Sources
Financial Disclaimer
This content is for informational purposes only and does not constitute financial advice. Consult a qualified financial advisor before making investment decisions.