Brent Crude
$92.40+1.8%
Market intelligence for geopolitical risk
Market intelligence for geopolitical risk
Last updated: March 6, 2026
DEFENSE
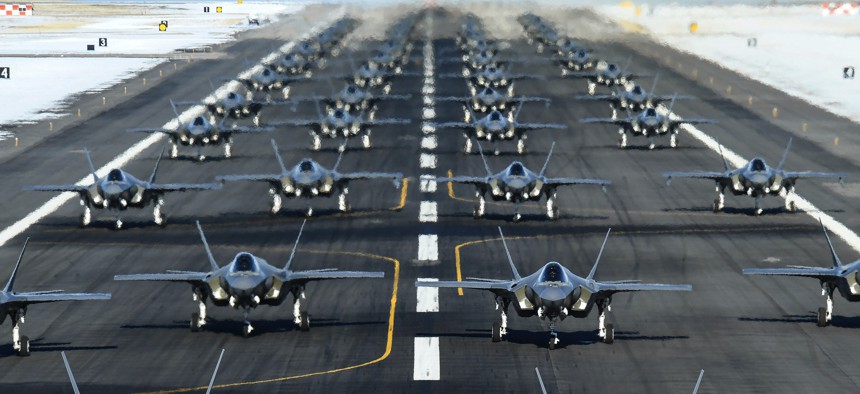
How to read the FY2026 U.S. defense budget request for procurement and readiness signals.
Focus: procurement mix
Read Analysis →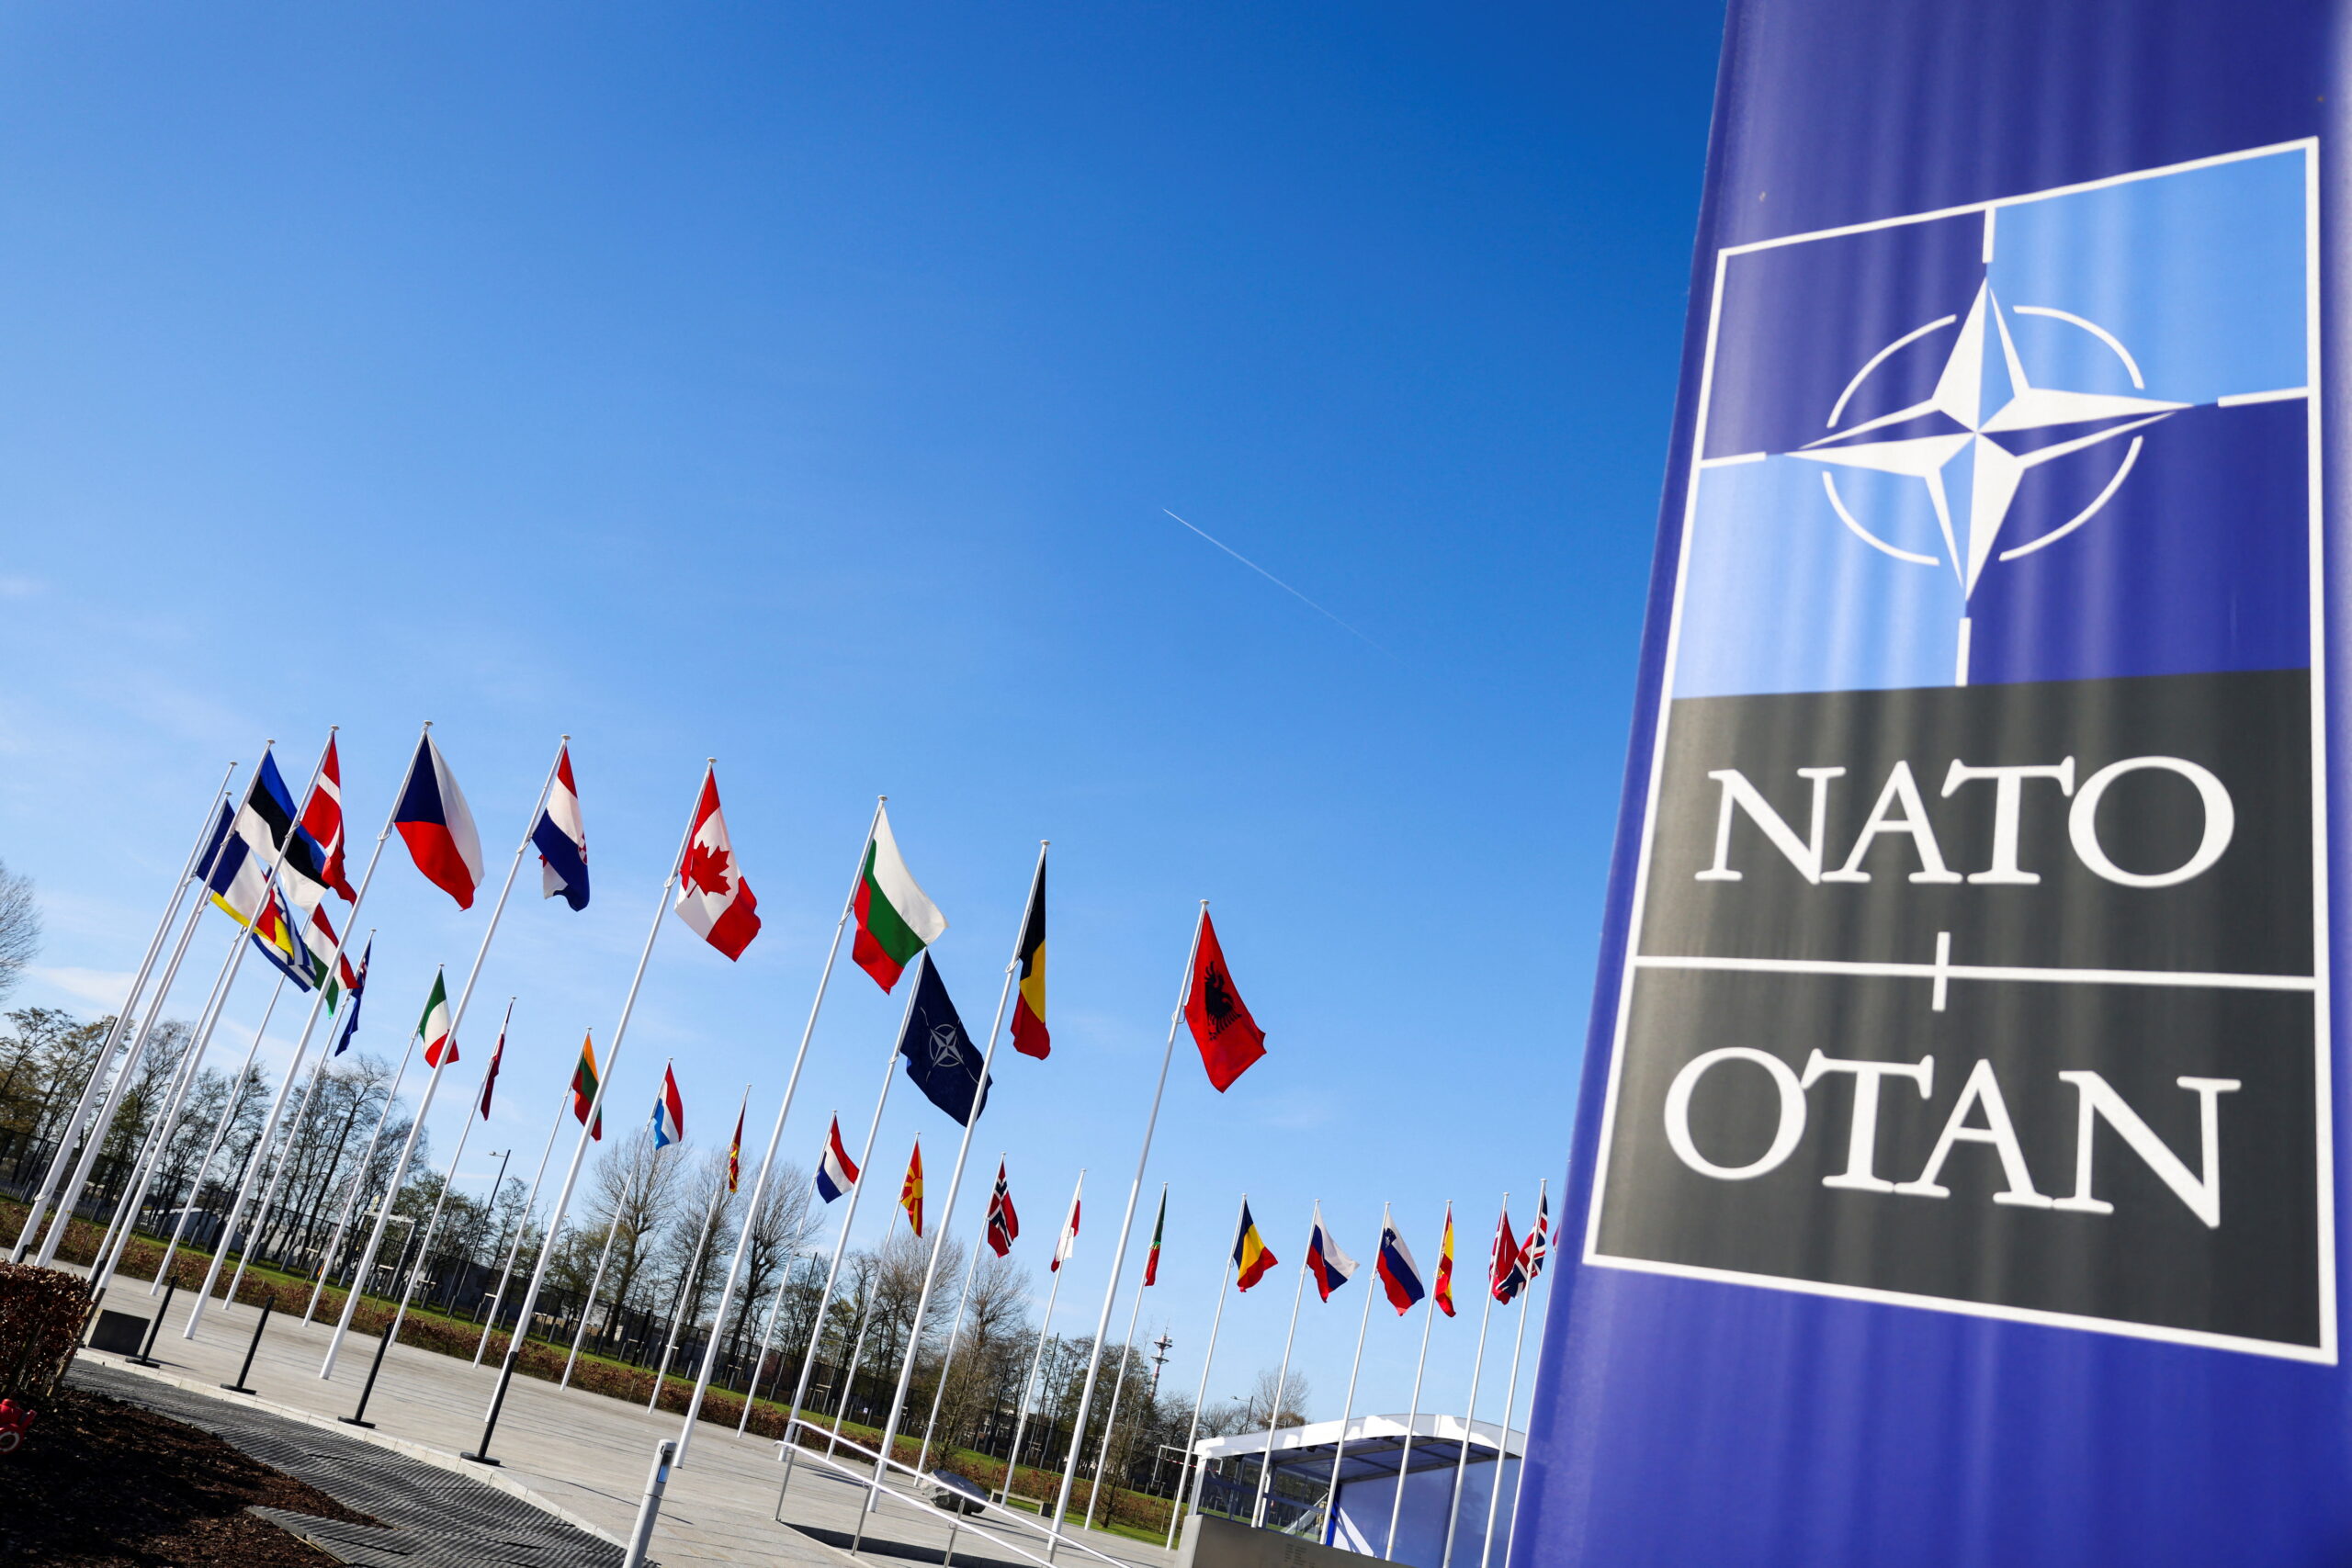
DEFENSE
How to read NATO's latest spending data without reducing the story to one headline ratio.

DEFENSE
How to read Europe's defense-industrial debate through production, coordination, and bottlenecks.

HUB
Hub page linking oil pricing, Hormuz chokepoint risk, country exposure, and scenario tables.

HUB
Hub page linking historical returns, sector rotation, defense equity exposure, and portfolio behavior.
HUB
Hub page linking Hormuz and Red Sea route economics, insurance stress, and pass-through models.
HUB
Hub page linking recession risk, historical war economy data, and live market indicators.
HUB
A navigation hub for LNG shipping, gas storage, diesel tightness, and electricity-grid risk.
HUB
A hub for grain routes, wheat pricing, fertilizer costs, and food import stress.
HUB
A hub for sanctions, export controls, shadow fleet risk, insurance, and critical minerals restrictions.
HUB
A hub for semiconductor concentration, copper logistics, port cyber risk, and cable resilience.
Each stream entry links to a full analysis page with data tables, scenario framing, and related cross-asset context. Use the full archive at /blog for every current and legacy page.
How to read the FY2026 U.S. defense budget request for procurement and readiness signals.
Focus: procurement mix
How to read NATO's latest spending data without reducing the story to one headline ratio.
Focus: capability over slogans
How to read Europe's defense-industrial debate through production, coordination, and bottlenecks.
Focus: throughput and bottlenecks
How munitions ramp-up runs through tooling, components, labor, and industrial lead times.
Focus: lead times and output
How the Russian oil price cap works through maritime services, documentation, and enforcement gaps.
Focus: services and compliance
How the shadow fleet changes tanker servicing, safety oversight, and sanctions enforcement.
Focus: alternative service networks
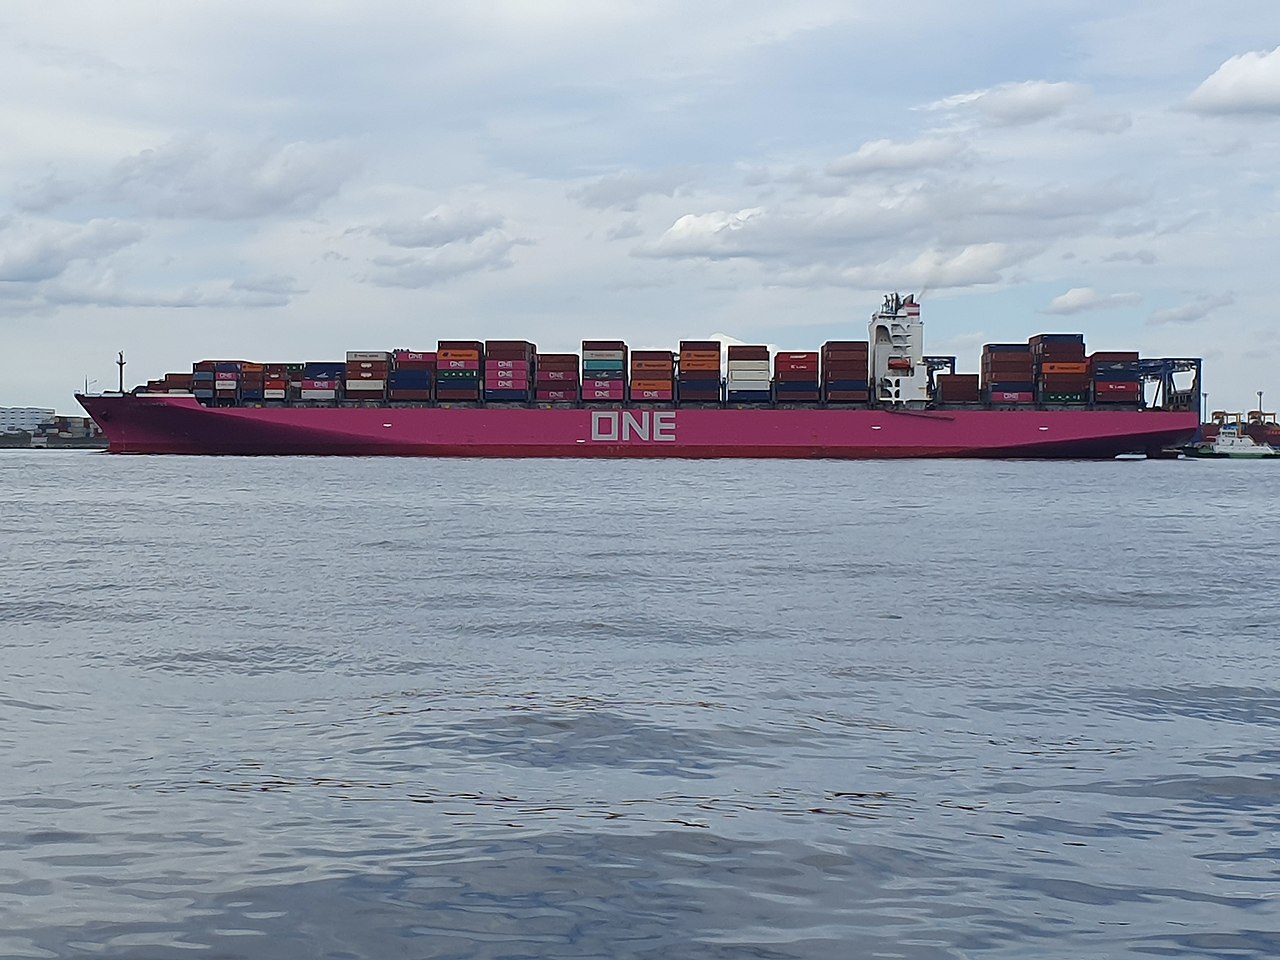
How war-risk premiums raise shipping cost, rerouting pressure, and trade friction.
Focus: shipping cost transmission
How to read Europe's gas storage data without overreacting to a single headline number.
Data focus: inventories and refill
A procedural explainer on LNG routes, fleet flexibility, and destination switching.
Focus: route optionality
How grid shocks reach power prices, backup fuel demand, and industrial output.
Focus: resilience and balancing
How distillates tighten through refinery, logistics, and freight channels.
Focus: downstream bottlenecks
How food import bills rise through commodity, freight, and financing channels.
Focus: buyer-side stress
Use the site's live archive and feed endpoints instead of a placeholder signup form.
Homepage and article preview visuals are sourced from open-license photography libraries.
War and Markets is a financial intelligence resource focused on market transmission, not battlefield reporting. Each analysis links data sources, timestamps assumptions, and cross-references adjacent pages to improve decision quality.
Reader context: About | Methodology | Editorial Standards | Research Map
This content is for informational purposes only and does not constitute financial advice. Consult a qualified financial advisor before making investment decisions.