Methodology
This analysis uses a scenario framework that combines market pricing, route/shipping evidence, policy signals, and macro confirmation data. Assumptions are reviewed on a weekly cadence and stress-tested under base, escalation, and tail-risk regimes.
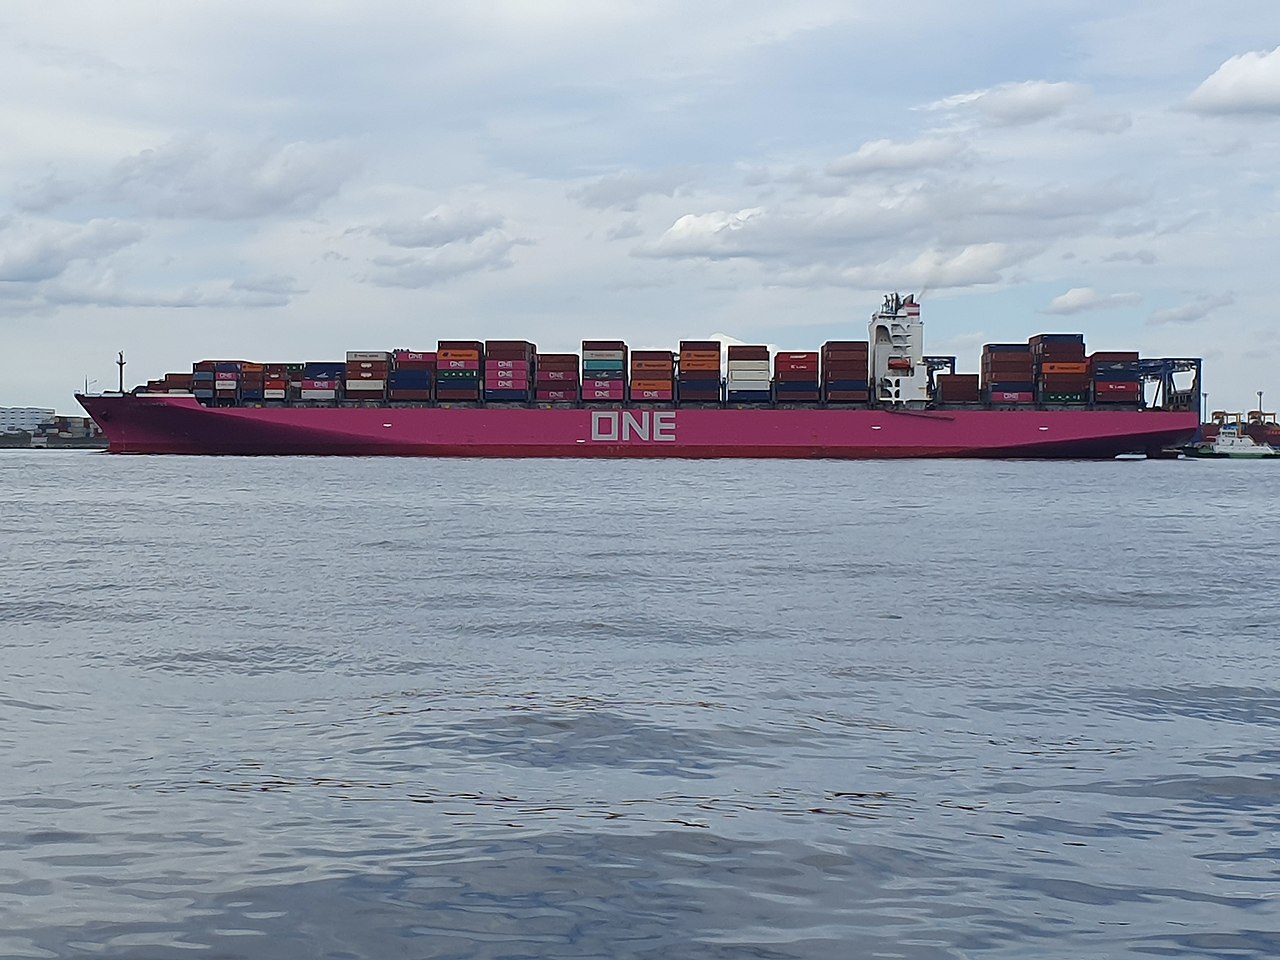
- Primary decision focus: Is shipping friction reducing effective LNG supply enough to alter the regional balance?
- Signal lens A: voyage duration and vessel flexibility
- Signal lens B: storage resilience and destination switching
TL;DR
- LNG disruption is usually measured in delay, detour, and fleet tightness before it becomes a full balance problem.
- Canal access matters because rerouting absorbs vessel time and narrows flexibility.
- Route optionality helps, but it does not eliminate local shortages or procurement stress.
- The right companion data is shipping-flow and storage data, not benchmark gas prices alone.
What We Know
IEA gas reporting consistently frames LNG as a balancing tool that still depends on ships, terminals, and timing. A cargo may be movable in theory, but the market effect depends on how quickly it can change destination and whether the buyer has the regasification access and ship time to receive it.
That is why route stress matters even without an outright closure. When voyages lengthen, the effective fleet shrinks. When insurance or routing becomes more uncertain, the local buyer may have to pay more or wait longer even if global molecules still exist.
For confirmation, compare this section with Diesel Markets During Conflict: Why Distillates Tighten Fast and Country Energy Import Exposure: Japan, India, EU, and China. This is where the site's cluster structure becomes useful: compare mechanism, market effect, and portfolio impact.
How To Read The Shipping Signal
The most useful signals are operational. PortWatch and UNCTAD transport data help readers see whether cargo movement is slowing, rerouting, or bunching into new corridors. Those are often better indicators of durable stress than a one-day price move.
- Watch average voyage length and route substitution.
- Check whether buyers are competing for flexible cargoes.
- Pair shipping data with storage conditions, especially in Europe and Asia.
- Treat a freight squeeze as a capacity story, not only a price story.
For confirmation, compare this section with Electricity Grid Attacks and Power Markets: How the Shock Spreads and Shadow Fleet Explained: Tankers, Safety, and Enforcement Limits. Read them together so lng shipping routes war risk sits inside a wider transmission chain.
What's Next
The next key question is whether shipping patterns normalize fast enough to keep refill or procurement plans on schedule. If they do, the shock may remain tactical. If they do not, the longer route structure starts to look like a supply reduction in practice.
Why It Matters
This page deliberately avoids the crude-specific angle already covered elsewhere in the repo. Its subject is LNG's own logistics: route length, vessel utilization, destination switching, and how those translate into regional gas risk.
That makes it a better fit for informational search intent and a better internal-link node for the gas-and-power cluster.
If this signal shifts, cross-check Diesel Markets During Conflict: Why Distillates Tighten Fast and Country Energy Import Exposure: Japan, India, EU, and China. The combined read is usually more decision-useful than treating this page as a stand-alone answer.
Contextual next steps for lng shipping routes war risk: Europe Gas Storage Explained for 2026: What the Data Says; Red Sea Shipping News Today: Costs, Delays, and Market Exposure; Diesel Markets During Conflict: Why Distillates Tighten Fast; Country Energy Import Exposure: Japan, India, EU, and China; Electricity Grid Attacks and Power Markets: How the Shock Spreads. Use this sequence to validate assumptions before adjusting allocations.
- Europe Gas Storage Explained for 2026: What the Data Says - complementary read 1 for lng shipping routes war risk.
- Red Sea Shipping News Today: Costs, Delays, and Market Exposure - complementary read 2 for lng shipping routes war risk.
- Diesel Markets During Conflict: Why Distillates Tighten Fast - complementary read 3 for lng shipping routes war risk.
- Country Energy Import Exposure: Japan, India, EU, and China - complementary read 4 for lng shipping routes war risk.
- Electricity Grid Attacks and Power Markets: How the Shock Spreads - complementary read 5 for lng shipping routes war risk.
FAQ
Can LNG always be rerouted?
No. Cargoes are flexible, but ship time, terminal access, and buyer contracts still limit the practical response.
What is the best leading indicator?
Shipping-flow, delay, and storage data are usually more informative than a single benchmark price spike.
Why is this different from the shipping hub?
Because the focus here is LNG market mechanics rather than chokepoints in general.
Sources
Financial Disclaimer
This content is for informational purposes only and does not constitute financial advice. Consult a qualified financial advisor before making investment decisions.